ESSA Report Card Design Challenge
Context
The U.S. Department of Education and the Data Quality Campaign hosted technical experts, subject matter experts, state leaders, parents, and other stakeholders for two days of sketching, prototyping and building solutions to help states design family-friendly approaches to report cards that make school data more transparent and accessible.
Vision
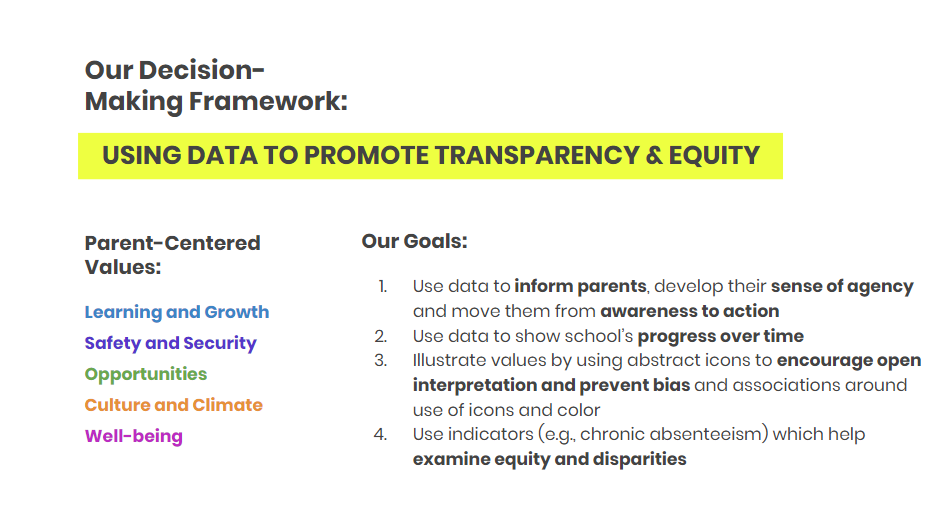
We wanted our design to use data to promote school transparency and equity. We identified five parent-centered values that informed our design (below). Ultimately, we wanted to create an opportunity for data to inform parents, develop their sense of agency, and move them from awareness to action.
Strategy
"If I had only one hour to save the world, I would spend fifty-five minutes defining the problem, and only five minutes finding the solution."
-Albert Einstein
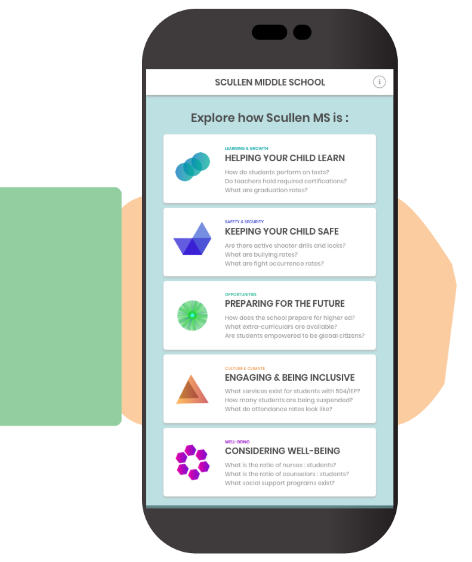
With a time constraint of about a day for this challenge, my team and I decided that it would be the best use of our time to spend most of it asking questions to our most important stakeholders: parents. With a number of parents in the room we asked them about what was important to them when reviewing their school's report card. After we gathered these responses and mapped them out we were then able to define the parent-centered values (listed above). These values then set the foundation of the questions-driven app that we created.
Outcome
We created a wire frame that we were able to test and iterate with the relevant stakeholders that were in the room and then presented our prototype to a panel of judges. At the end of the challenge, we won the awards for Best Data Visualization, as well as Best Overall Design.
For more information about the challenge, our prototype, and feedback please visit the DOE website here.
Team
Jessica Panicola
Rutvika Gupta
Umila Singh